A weekly snapshot of global markets and economic data — growth, inflation, financial indicators and commodities — for September 3, 2026.
September 3, 2026
- Scoreboard dated September 3, 2026, covering global economic benchmarks and market indicators.
- Four tables reproduced from The Economist: economic indicators, financial markets, commodity prices, and currencies and bonds.
- Use as a quick reference for early September 2026 — compare tables side-by-side for context.
This scoreboard brings together global economic data and market movements for early September 2026 in a single view. The tables below present the benchmarks for growth and prices alongside financial and commodity indicators, as compiled for September 3, 2026.
Each table is shown as published and credited to The Economist. Read them together for a broad cross-market snapshot rather than as forecasts or recommendations.
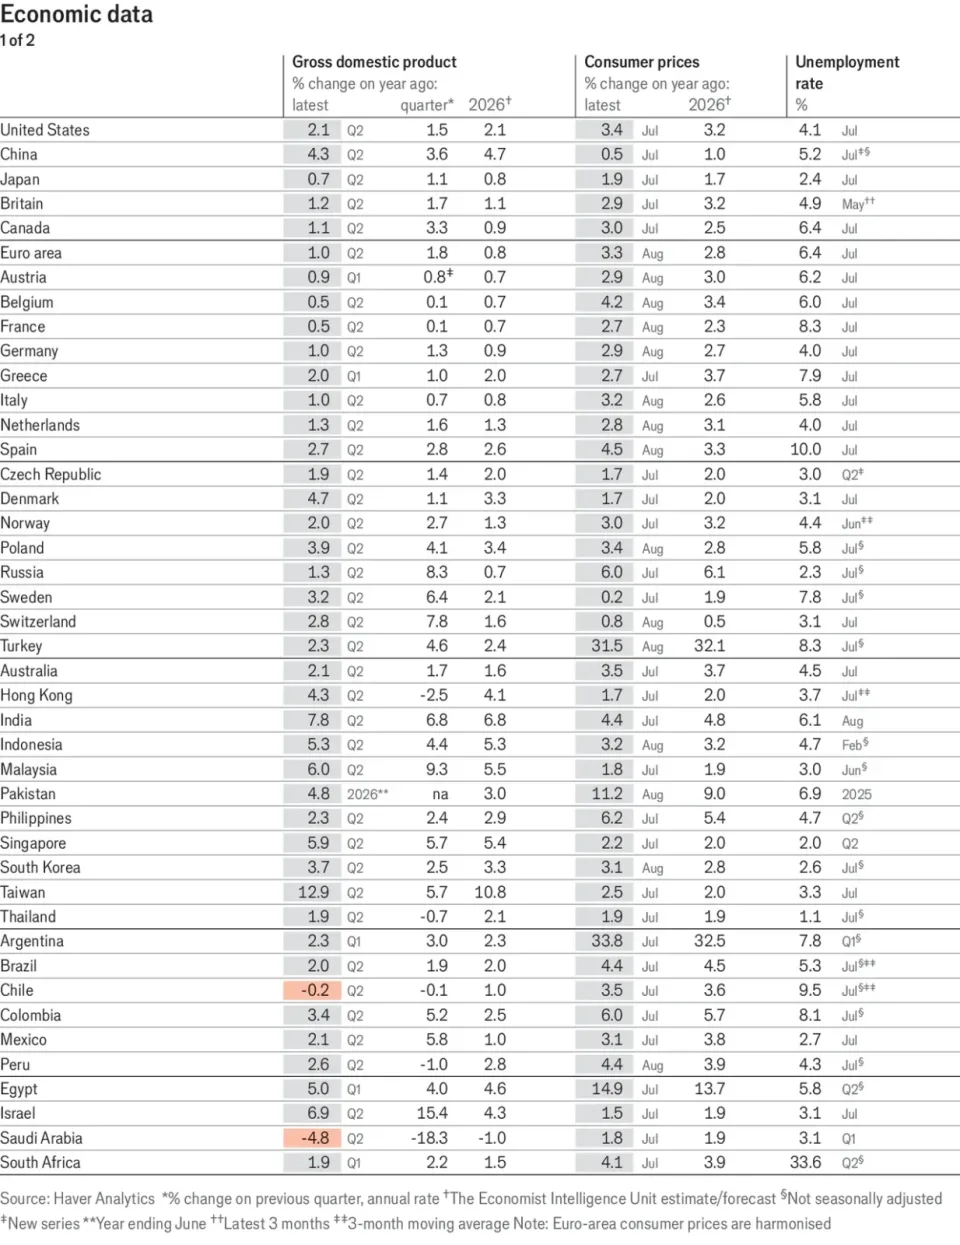
Global economic indicators
The opening table summarises core economic benchmarks by economy — the headline view of growth and price trends that frames the rest of the scoreboard.
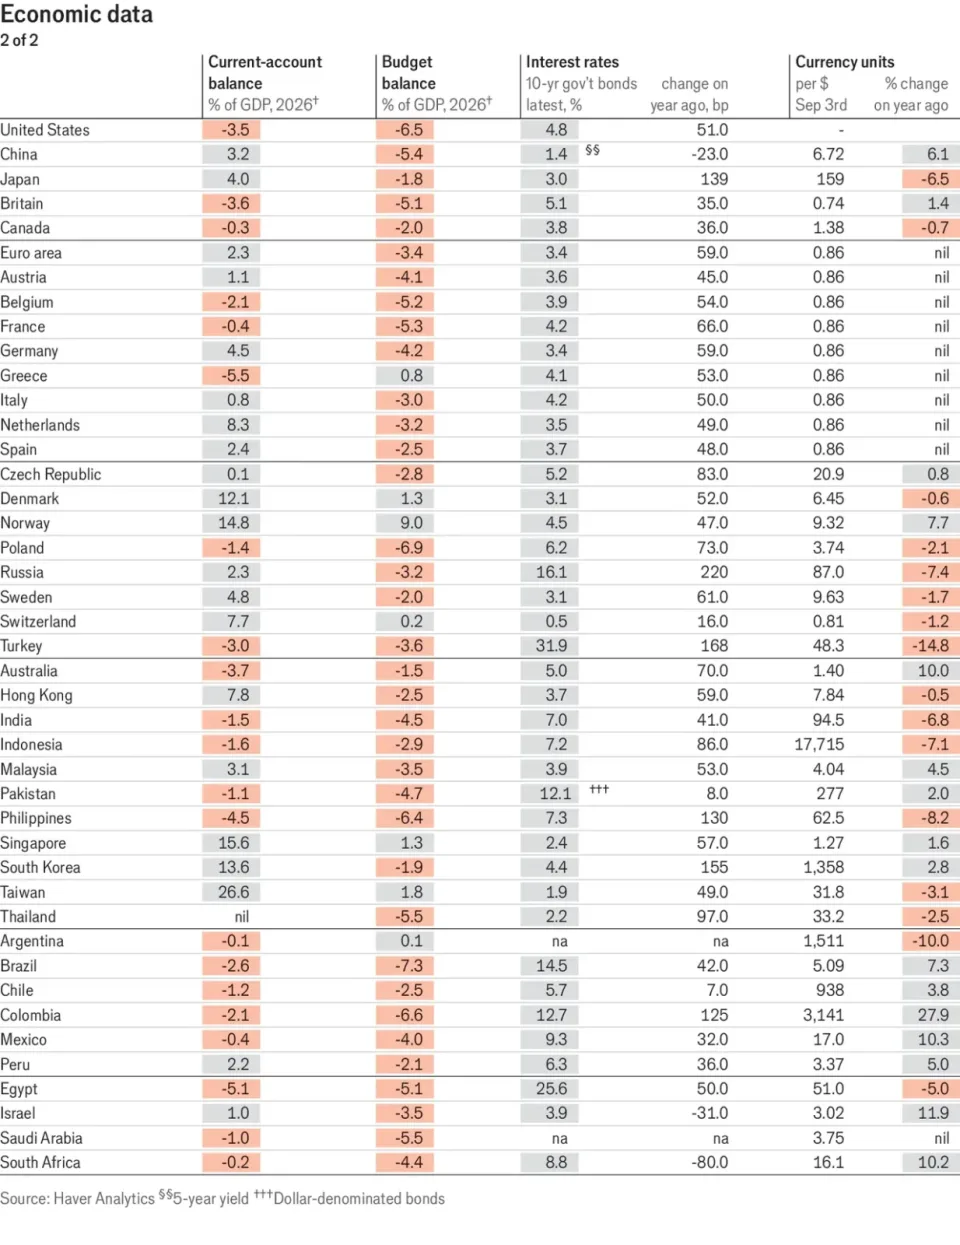
Financial markets
The second table collates financial-market movements, providing the market-indicator counterpart to the economic benchmarks above.
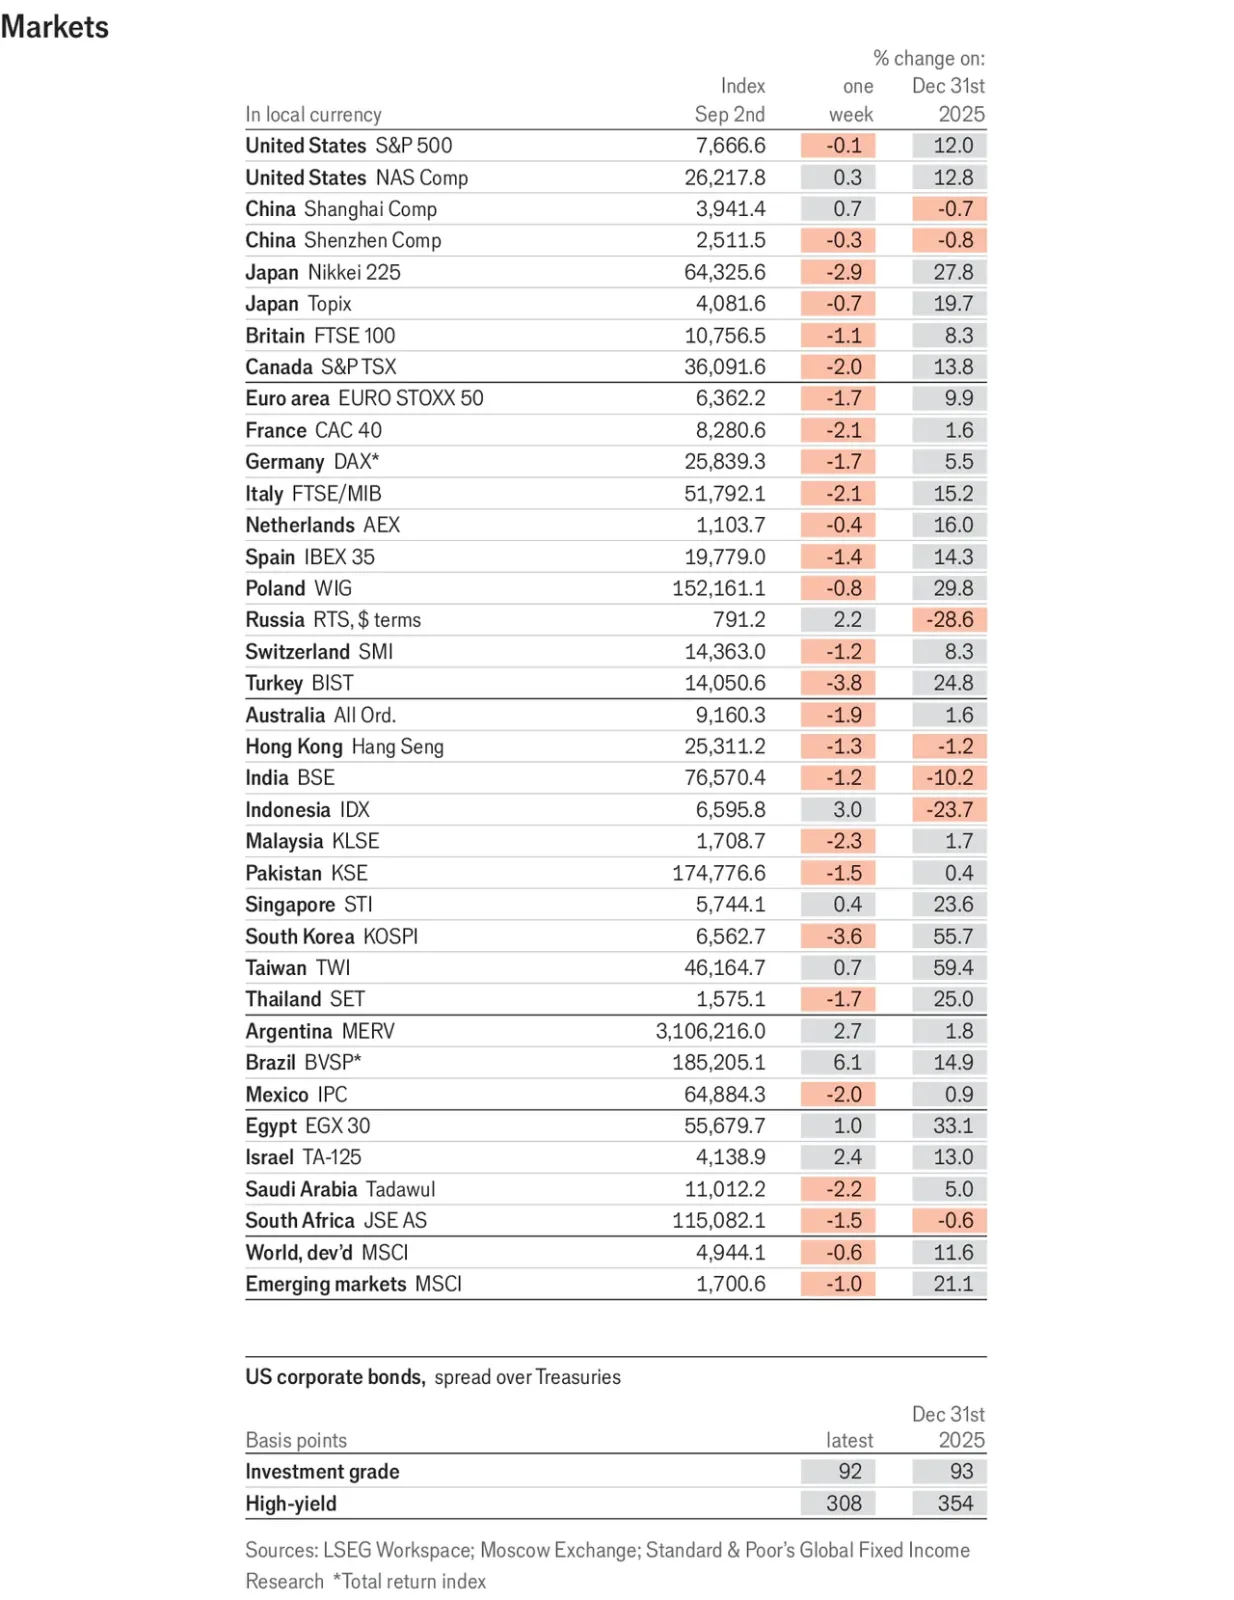
Commodity prices
Commodity prices are shown separately to track raw-material and energy benchmarks alongside the broader financial indicators.
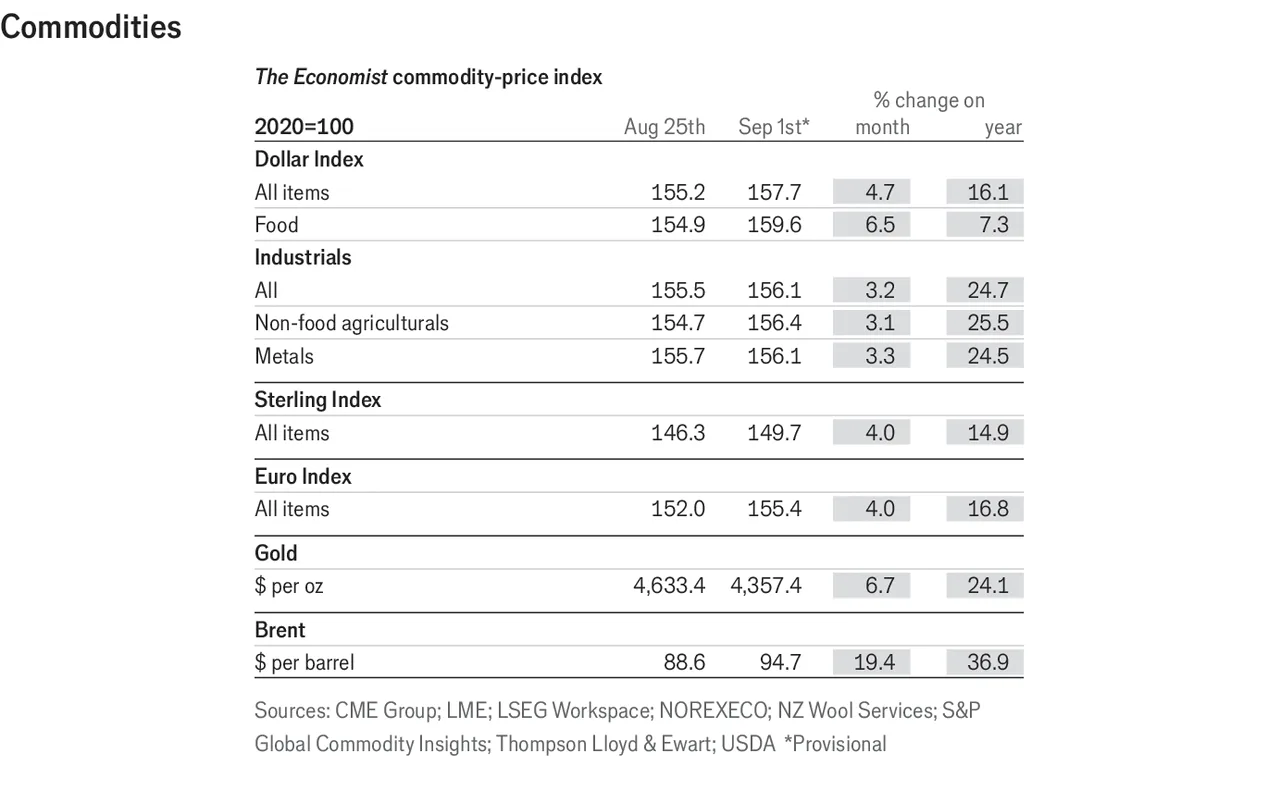
Currencies and bond markets
The final table covers currencies and bond markets, completing the early-September snapshot with foreign-exchange and fixed-income benchmarks.
Tables are reproduced as images as published for September 3, 2026. For precise figures, refer to the enlarged tables and the original compilation by The Economist. Values are point-in-time benchmarks, not forecasts.
Published September 11, 2026. Data as of September 3, 2026.
Sources
Data tables: The Economist, September 3, 2026 edition.
Tables presented as images; enlarge to read detailed figures and footnotes.
KEEP THE CONVERSATION GOING
A good story is worth sharing.
Send this story to someone who values the bigger picture.
See more from GlobeBriefly on Google
Choose us as a preferred source in your Google preferences.